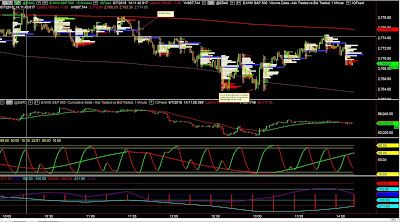
Now lets put the training wheels on. The chart below shows the tried and true original ElectronicLocal indicators I started using before all the direct order flow information was available. These indicators are now a filter or help in seeing the order flow.
The triggers are purely off the Volume Profiles, price action and Cumulative Delta but the indicators, which I have been watching for well over 12 years, are a good security blanket and also become the judge in case of any analysis paralysis. I must also confess that using the indicators as well, results in me seeing things more quickly at this time.
I have marked an entry and exit on the chart. As you can see the trade made the proverbial 10 point buck as we used to say in the "good old days". One of the aims of this methodology was to enable me to take more profit out of a trade - resulting in a much higher average profit over time. There's a lot of noise as the HFTs and other algos go about their business in the markets and being able to filter out this noise, rather than trying to trade it, has become one of the important "to do" actions in this new trading environment.
I'm currently adding the semi automation to the charts. Still being tweaked as the technology is catching up to my needs. The semi automation means I can arm Flo (see previous posts about automation) when I see the context is coming together so that Flo triggers the trade fully automatically once all conditions have been met. Flo will also shoot out the scale out targets and stops. When I eye ball the chart, these targets and stops can be adjusted if necessary. This way I can trade several markets at the same time. Adding alerts to markets can also help this multi tasking so that as context is coming together I can pay more attention and arm Flo if applicable.
This has now become a whole new trading plan that is both back testable and applicable to all time frames and markets.


Hi Tom, I see sometimes a divergencies between cummulative delta and price. Just before a big move, cummulative delta goes down, but price is just sitting there. And then when cummulative delta goes up, price goes through resistance. Or vice versa. Does this mean that their are buyers that just take and take what sellers are willing to sell and that cummulative delta register the footprint as 'sell' but in fact it is an accumulation?
ReplyDelete