
MY METHODOLOGY STAYS THE SAME!!!!!!!!!!!!!!!!
I am trading the order flow - identifying the trend and trading the pullbacks in that trend.
So what changes? I adjust the strength of my microscope. Just like any scientist, I turn the knob until I can clearly see what I need to see. The knob in my case is the size of the range bars and sensitivity of my trend measurement tool - the longer term CCI.
I have been posting these variations during the last few months so you can see the possibilities. There is no "right" setting other than the one that enables you to clearly see what "they" are doing.
The summer doldrums are upon us, but with the back ground of severe world financial problems. I see it like a square that I used to make as a kid out of ice cream sticks- pinning four of them into a square, but which I could make into a rhomboid of varying types just by moving two opposite corners. The only way I could keep the square was to add a fifth stick, a diagonal.
The problem in the world today is that there is no diagonal and our square can become a rhomboid of any shape.
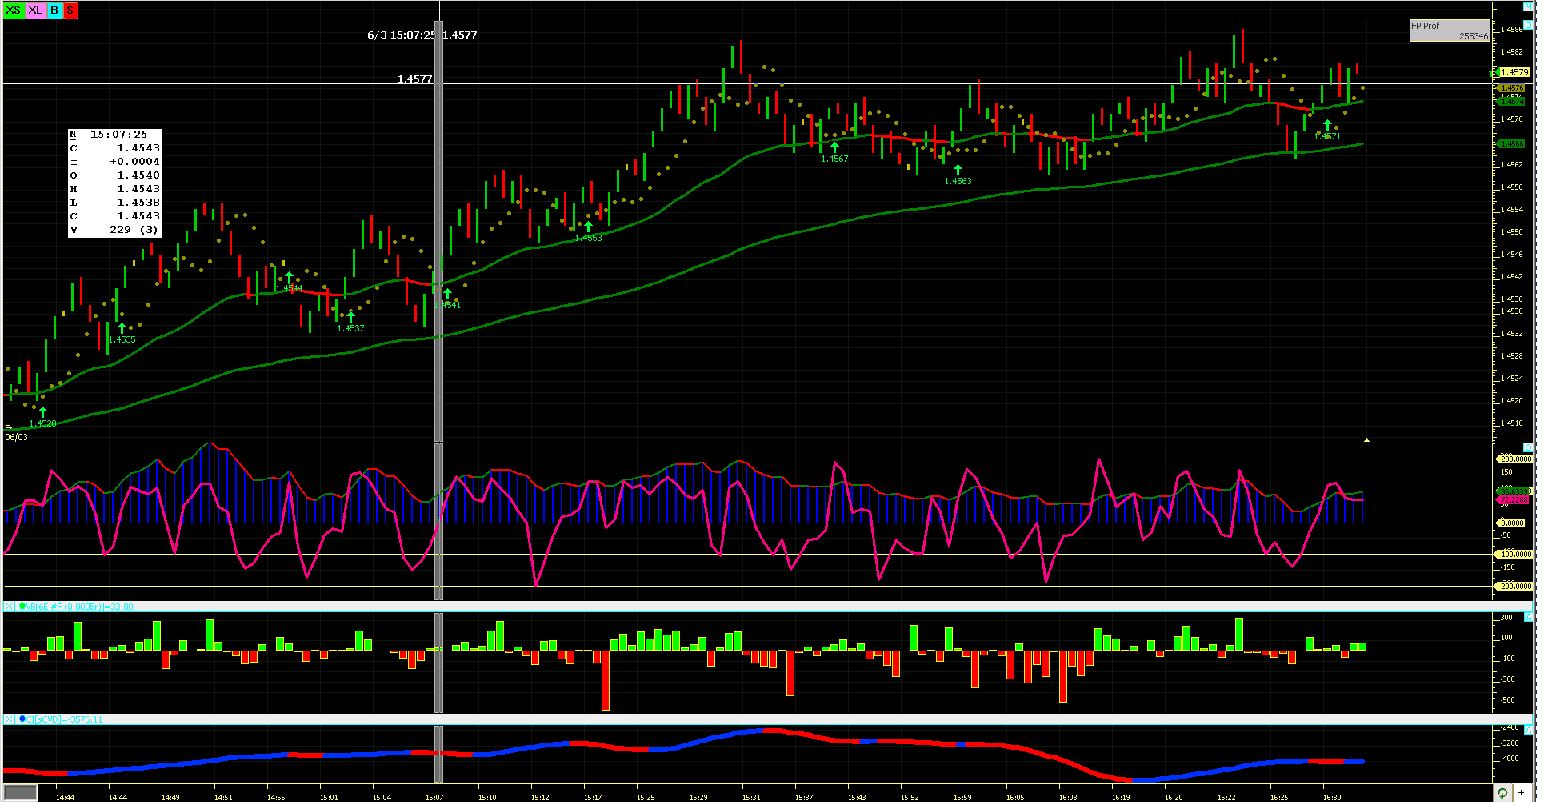
The Euro came back to life. A couple of my students are test-driving Flo. One of them emailed me that the Euro "was like shooting a fish in barrel". I must say I agree with him. Just look at all the trades on this chart.
great analogy with the microscope. thanks el
ReplyDeleteToday's chart doesn't look like range bars (uneven bar sizes). Are you using something different now?
ReplyDeleteAlso the Keltner seems to come and go. Is that still used?
ReplyDeleteAnon 14:16 Keltner is still there. Its just I can see it in my head and don't need it on the chart. I like to see the price cleanly and try to declutter the chart.
ReplyDelete