
I had anticipated another tight range day ahead of Powell (FED) talk tomorrow at the virtual Jackson Hole meeting. Not to be. The charts below show how a few of the trades were triggered by the order flow.
A little after the open a guy started selling an iceberg at 4487.75. I think he sold about 3000 contracts. Here's the chart showing the order flow then. The GREEN support you can see after the iceberg was filled showing that the buyers took all that the iceberg guy had to sell.

Price went against him a bit until the market cycled a bit until people got bored. He then seemed to come back and give it a good wack which set off a string of stops. The Bubble shows the wack.
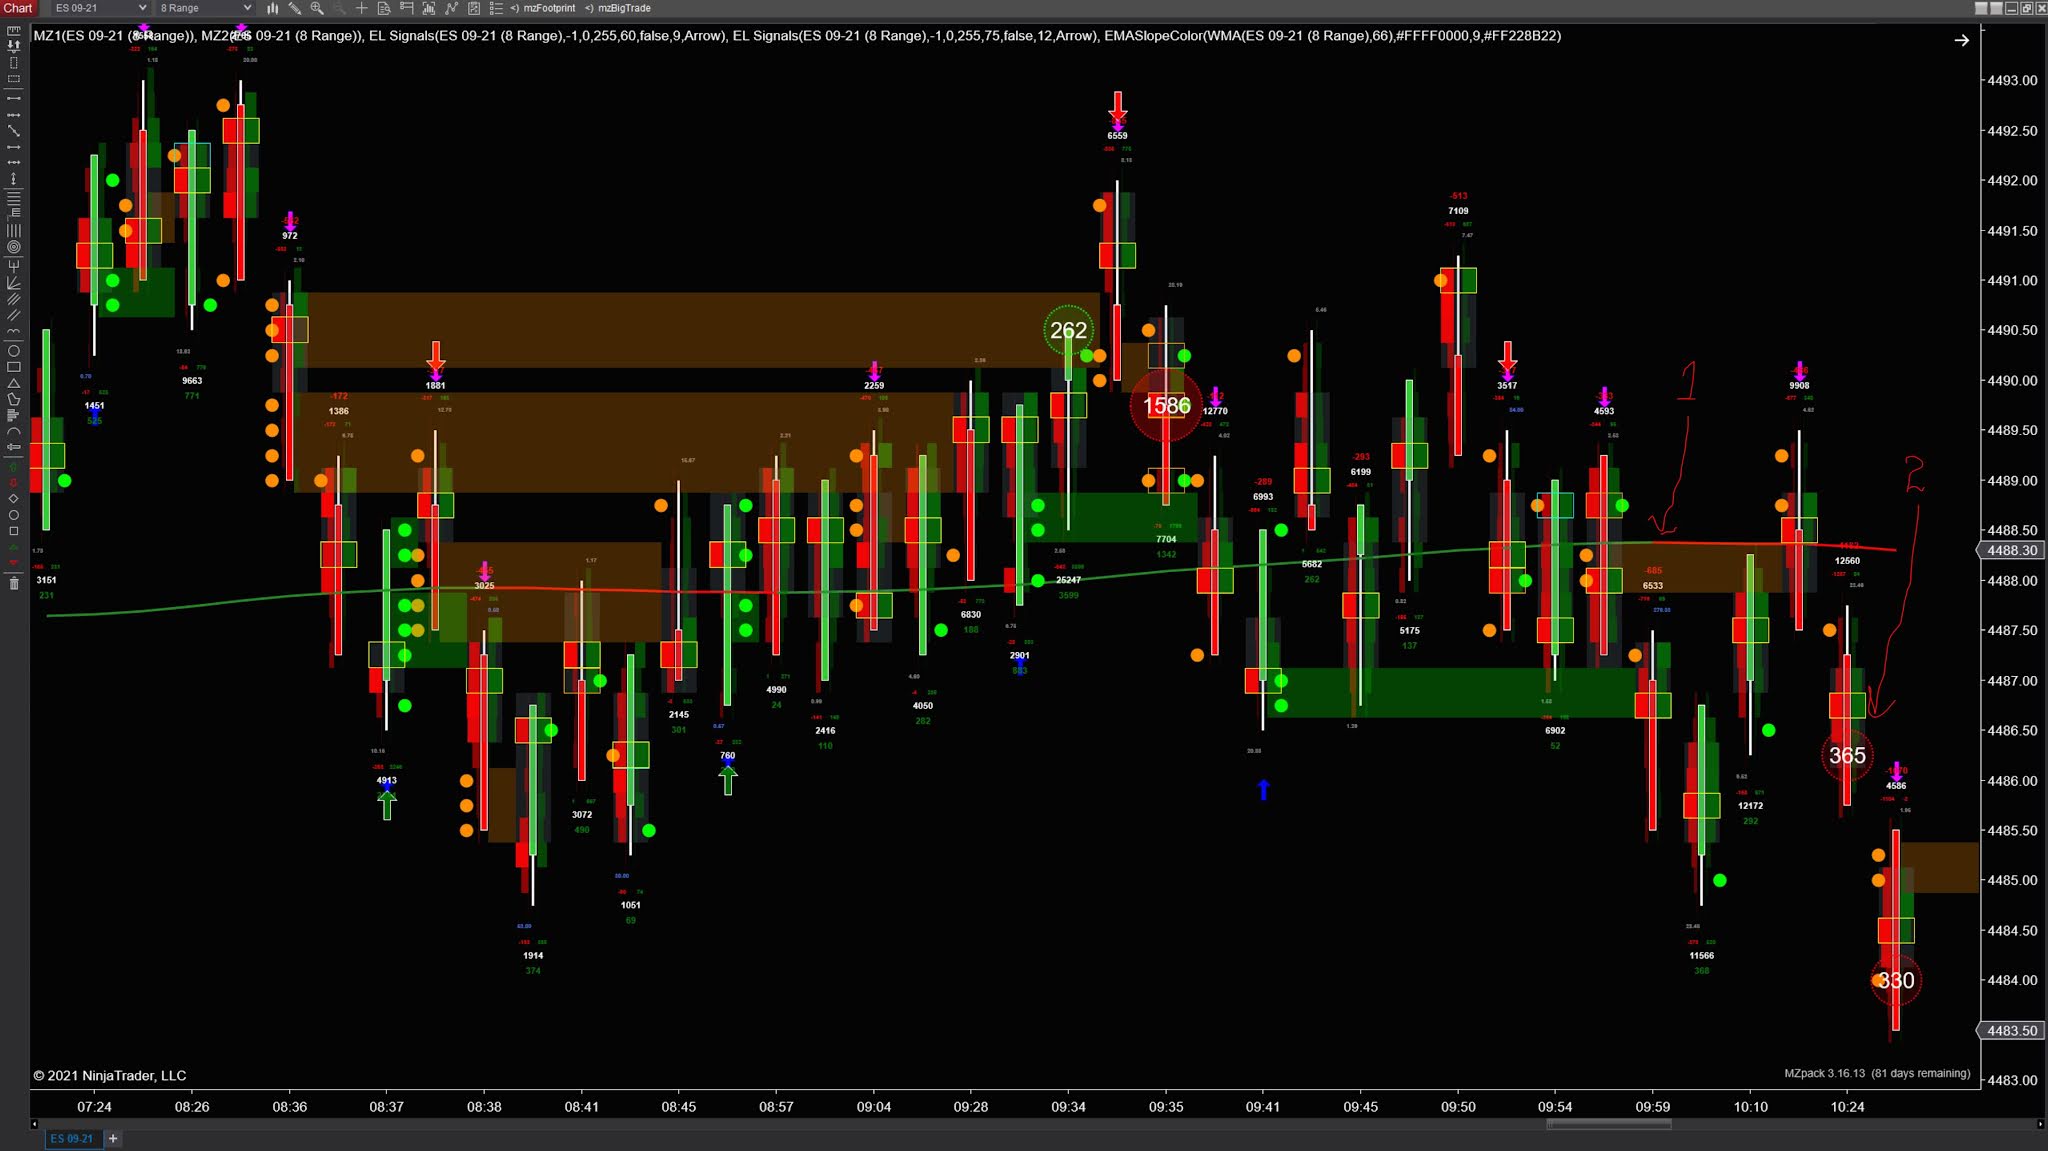
The bids were hit hard and stops were triggered and triggered until we ran out of sellers and buyers stepped in.

It got better - we got a retracement to the mean and got two chances to make some more money.

The key to trading these auction markets is to follow order flow and find the areas of support and resistance. The above charts do not show the context apart from where the mean is. I have been using Jigsaw's Auction Vista and Bookmap with their SI add-in that shows stops and some of the icebergs. I struggled to get any extra info from either of them although I really tried. My chart with added context and Market Profile tells me more and everything I need to know.
No comments:
Post a Comment